
Influencer marketing is a global trend and numerous Taiwanese brands are increasing their budgets for this strategy. They recognize the power of online influencers to connect with a broad audience of potential consumers to build a strong community reputation.
With a vast pool of influencers and varying social media effectiveness, brands need more than just interaction rates, follower growth rates, and view rates to analyse influencer marketing effectiveness, they also need key data to comprehensively plan influencer marketing strategies.
The KOL Radar Premium plan features brand-new AI-driven real-time data insights to offer a comprehensive “Influencer Data Dashboard”. This includes various data charts such as the “Fan Growth Trend Chart,” “Engagement Analysis Dashboard,” “Video View Analysis Dashboard,” “Posting Frequency/Time Analysis,” and “Content-Type Distribution,” among others. These insights empower brands to comprehensively understand changes in influencer community engagement effectiveness, thereby enabling the planning of more effective influencer marketing strategies.
Comprehensive Influencer Data Tracking for Seamless Influencer Marketing
1. Robust influencer filtering, Finding the Right Influencers from Millions of Profiles
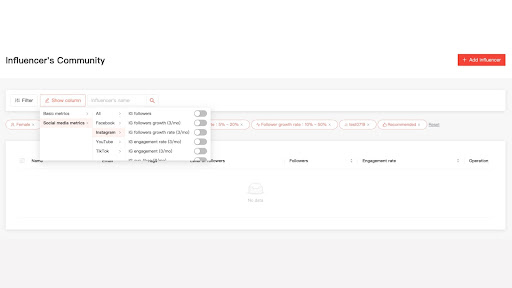
The KOL Radar cross-border influencer database contains millions of cross-border influencer profiles, including influencers from Taiwan, Japan, Hong Kong, and Malaysia. AI technology collects and organises influencer data from platforms like Instagram, YouTube, Facebook, TikTok, and Twitter. Brands can apply filters such as category, gender, follower count, engagement rate, follower growth rate, view rate, growth potential, and search period to discover the most suitable influencers.
The growth potential filter includes three options: “High Potential,” “Normal,” and “Decline.” This facilitates brands in swiftly identifying potential influencers, enabling them to seize the opportunity to collaborate with high-growth influencers.
2. Comprehensive Influencer Data Overview: Understanding Influencer Dynamics Across Platforms Through the K-Score Indicator
Many influencers manage multiple social media platforms simultaneously, causing brands a significant dilemma: “Which platform should we engage the influencer to promote on?”
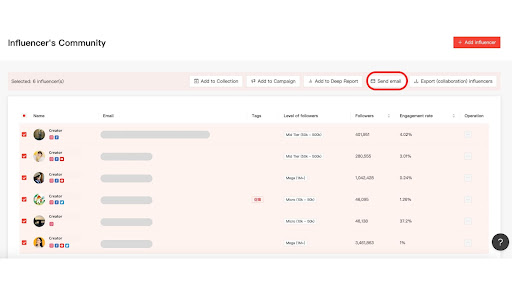
To facilitate brands in understanding the performance of influencers across various social media platforms, the KOL Radar Premium plan encompasses a comprehensive range of data on the effectiveness and interaction of influencers on different platforms. Brands can freely select the desired social media platform for review in the “Overview” tab. By cross-referencing the overall data overview, brands can accurately compare influencers’ performance on platforms such as Facebook, Instagram, YouTube, TikTok, Twitter, and more, gaining precise insights into the optimal platform effectiveness of influencers!
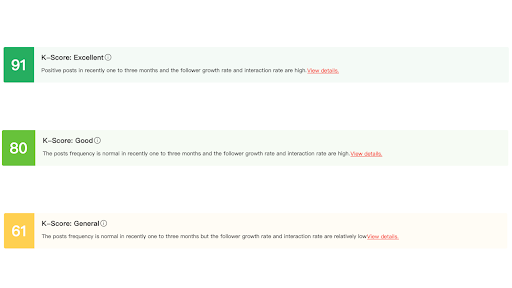
KOL Radar utilises AI technology to calculate the influencer’s K-Score, evaluating their influence through comprehensive metrics like follower count, posting consistency, follower growth rate, and engagement rate. This assessment results in a grading of the influencer’s impact, allowing brands to readily understand the current status and overall performance of the influencer’s community management.
3. Follower Count Trends Tracking: AI Monitors Identifying Potential Influencers
The landscape of the social media market is ever-changing, often witnessing the sudden rise of newcomers to fame. However, just as water can carry a boat, it can also sink it. Some influencers experience negative publicity due to controversies or inappropriate statements. These changes are often reflected in fluctuations in an influencer’s follower count.
To precisely understand the dynamics of an influencer’s follower community, the KOL Radar Premium plan introduces the “Follower Count Trend” tracking dashboard!
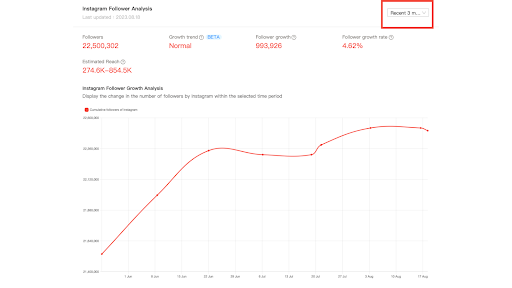
Brands can use the filters to adjust the timeframe to the past three months or six months, to monitor the follower count changes across the influencer’s various social media platforms. Follower count and follower growth rate serve as crucial indicators for assessing the popularity of an influencer. Brands can use these metrics to gauge the popularity of influencers among their followers. By collaborating with influencers experiencing follower growth, brands can enhance their exposure and engagement within the community, leveraging the benefits of increasing popularity for their campaigns!
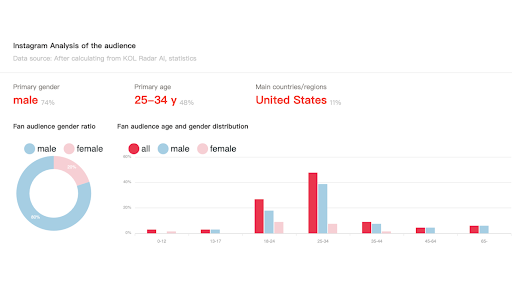
4. Influencer Audience Analysis: Target the Right Market
When selecting collaborating influencers, brands need to understand the influencer’s audience demographics to effectively reach their target market. However, obtaining fundamental information about the influencer’s audience can be challenging.
KOL Radar offers an “Audience Analysis” dashboard, utilising exclusive AI crawling technology to automatically analyse the influencer’s audience demographics on Instagram, YouTube, and Facebook platforms. Brands can assess information such as gender and age distribution of the influencer’s followers and select influencers whose audience profiles closely align with the target audience. Brands can precisely target their target market, optimising their promotional efforts!
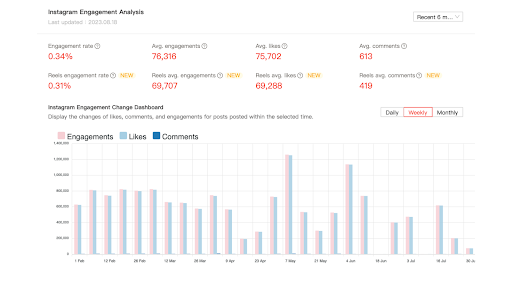
5. Social Interaction Trend: Analyse Interaction Metrics Over Time
When brands want to assess an influencer’s interaction effectiveness, they often have to individually review all the data from the influencer’s posts, which is time-wasting and inefficient.
The KOL Radar Premium plan includes an “Engagement Analysis Dashboard,” enabling brands to effortlessly observe the effectiveness of various interaction metrics within the past three months or six months for influencers. Brands can also freely choose different time intervals such as “day, week, month,” and adjust the chart presentation format. By analysing the fluctuations in interaction numbers, likes, comments, and shares across different periods, brands can identify the influencers with the best interaction performance, fostering a trend of community engagement!
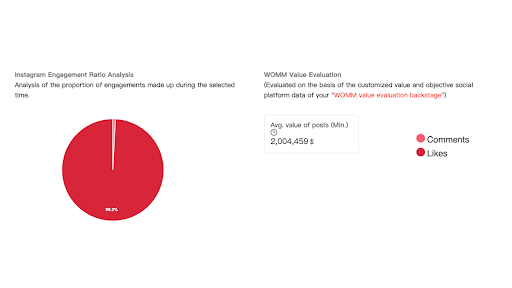
Simultaneously, KOL Radar also offers an advanced “Interaction Percentage Analysis Chart” and “Reputation Value Estimation.” Utilising the “Interaction Percentage Analysis Chart,” brands can gain deeper insights into the interaction metrics where influencers hold the highest percentage, crafting strategies such as “contests to boost sharing” / “comments for building reputation”. On the other hand, the “Reputation Value Estimation” provides brands with customizable settings based on advertising budgets and past digital media buying experiences. KOL Radar then automates a rough budget estimation using the influencer’s effectiveness in the past three or six months, providing a reference for the value of influencer collaboration.
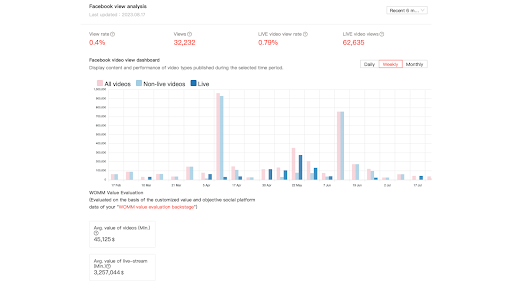
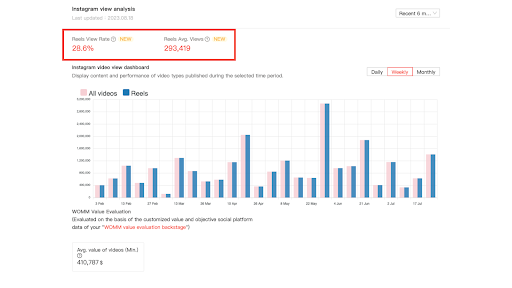
6. Video View Performance Analysis: Leverage Video Trends
With the rise of “short-form videos” and “live streaming” gaining popularity, major mainstream social media platforms have been introducing features for short-form videos and live shopping. This provides business opportunities for embedded video content.
KOL Radar Premium now includes the addition of “Comparative Charts for All Videos / Non-Live Videos / Live Video Views” on Facebook. Brands can also effectively utilise the dashboard to observe the general performance of KOLs on various social media platforms for regular videos, short videos, and live content over the past three or six months. By leveraging information on “Average Video Value” and “Average Live Value,” you can identify the most suitable ways to collaborate with KOLs and utilise the latest trends to create successful social media campaigns!
Furthermore, new data points have been added for “Reels View Rate” and “Average Reels Views.” Within the influencer’s page on KOL Radar, in the IG “Community Overview” and “View Analysis” sections, Brands can also select the past three or six months as time dimensions to observe data changes and trends. This enables brands to accurately and instantly grasp the real-time effectiveness of influencers’ Reels creations, capitalising on short-form video opportunities!
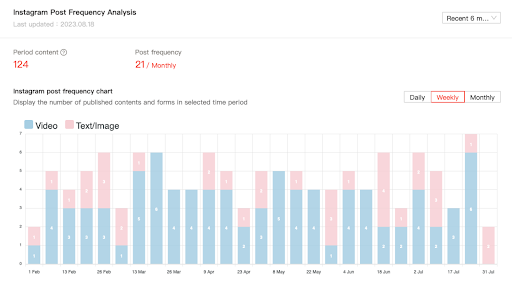
7. Content Publishing Analysis: Optimise Posting Times
Choosing the optimal posting time can bring the best exposure benefits for both brands and influencers. KOL Radar uses AI to automatically track and consolidate influencer “posting frequency,” “posting times,” “content types,” and “quantity,” to understand the influencer’s posting habits and ideal posting timings. This assists brands in identifying the best posting times for maximum exposure!
In the “Content Publishing Analysis” dashboard, KOL Radar employs stacked bar charts to show the quantity and posting frequency of graphic, video, and live content across various social media platforms within the past three or six months. Through the analytical charts, brands can switch between daily, weekly, and yearly time dimensions according to their needs. The stacked bar chart provides a clear overview of the frequency of influencer content-type postings. This aids in understanding the influencer’s content posting habits, and stability in community management, and serves as a basis for considering collaboration and strategic planning.
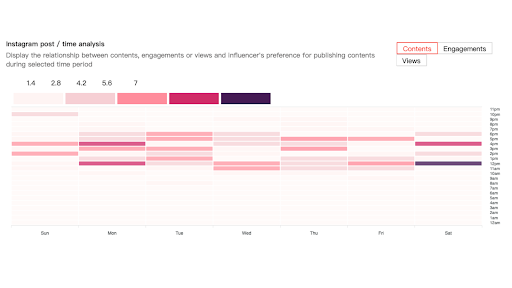
Furthermore, KOL Radar also visualises the influencer’s posting time analysis data into a heatmap. The filters allow switching between content count, interaction count, and view count. The colour gradient in the heatmap easily distinguishes the quantity of the selected metrics, providing insights into the relationship between posting timing and content effectiveness within the past three to six months.
Through the content posting time analysis chart, brands can understand the preferred posting times and optimal periods for content effectiveness across various social media platforms. By choosing to publish collaborative posts during these optimal times, brands can maximise the influencer’s impact and get impressive exposure rates!
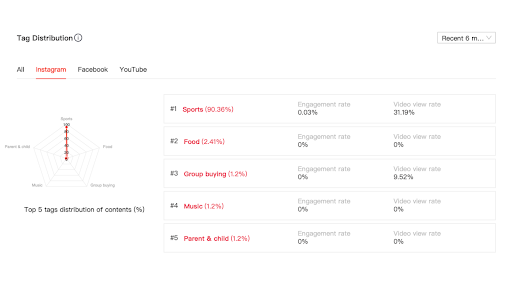
8. Post Content Type Performance Analysis: Understand Influencer Content Effectiveness
Influencers tend to experiment with various types of content over time, and many brands rely on the content type to assess potential collaborations. However, how can one stay up-to-date with the latest content of influencers?
Through exclusive AI crawling technology combined with NLP semantic analysis, KOL Radar automatically categories and tags all influencers’ content on social platforms in the database. Radar charts visualise data, such as the “Top Five Main Content Types” and their associated performance that influencers are currently focusing on in the community, offering insights into the content types influencers are currently emphasising.
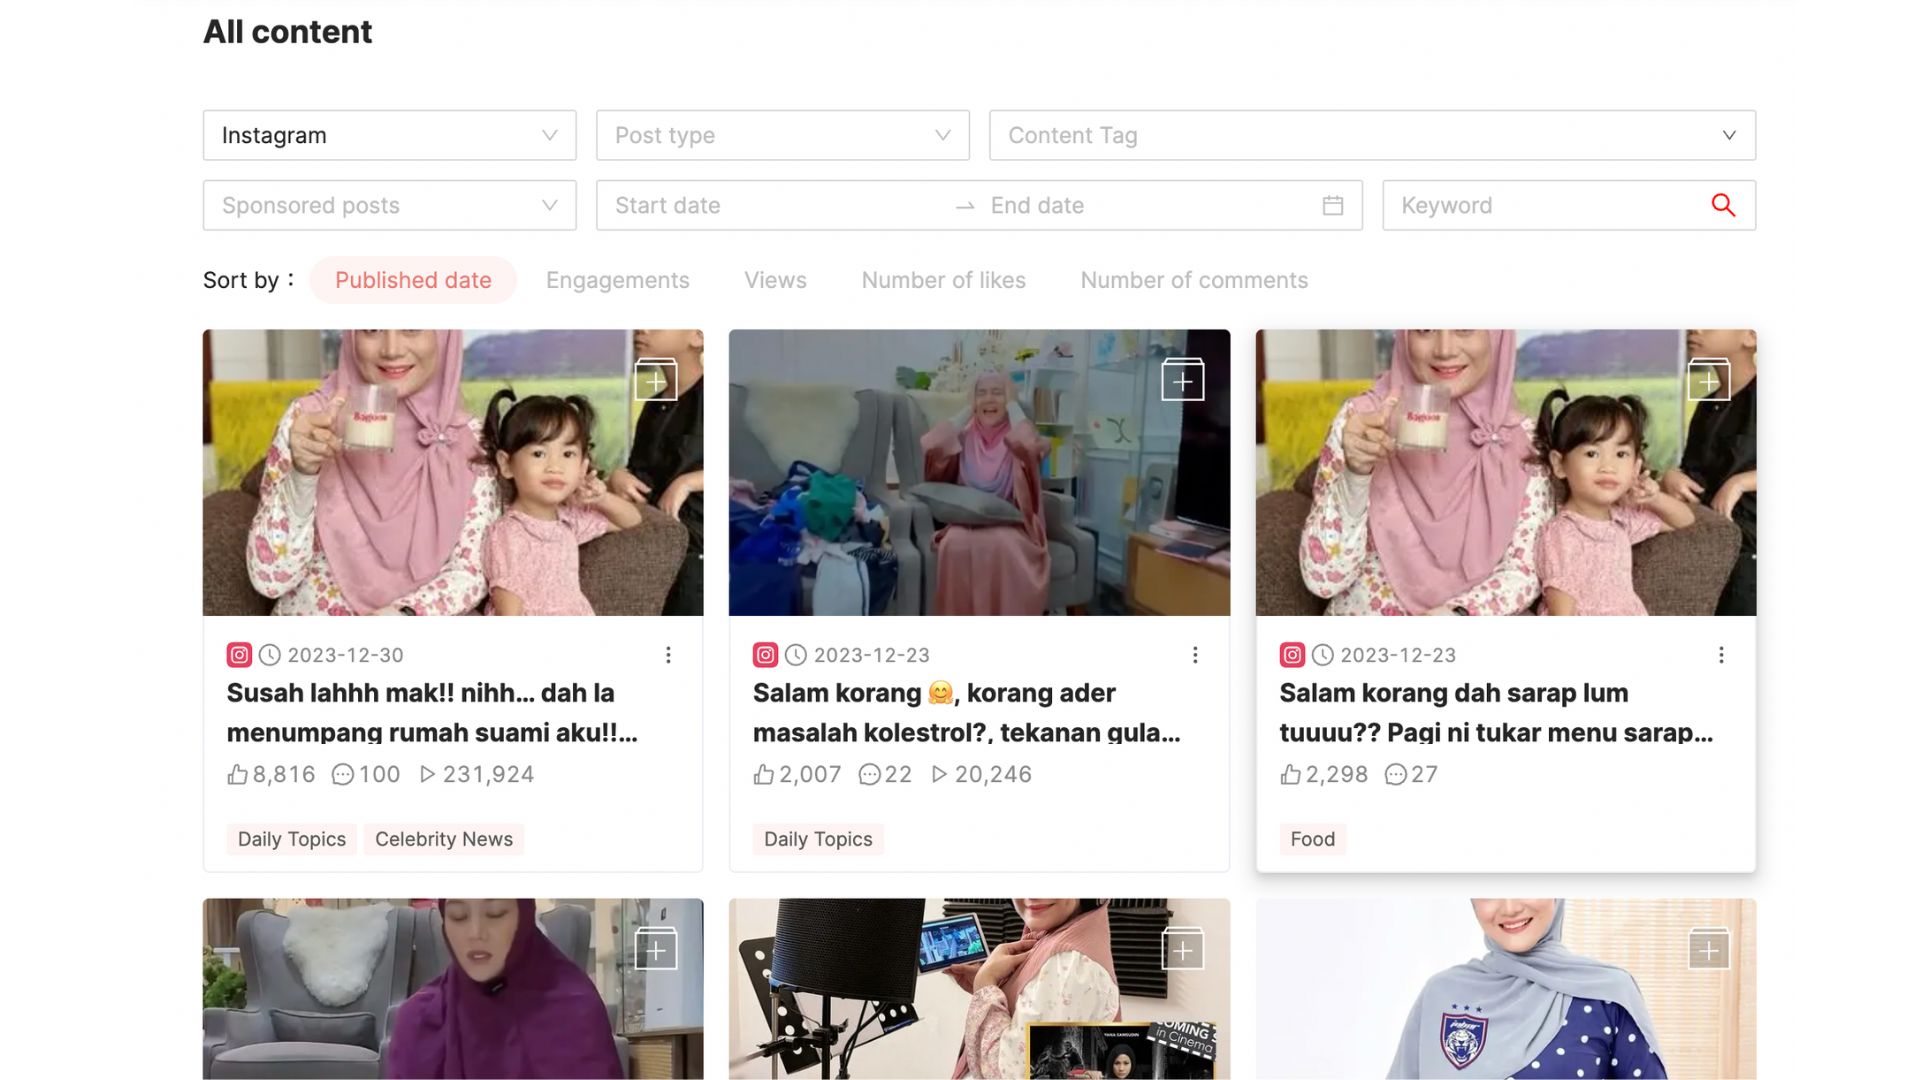
9. Influencer Content Retrieval: Easily Find Popular Content
The “Content Retrieval” feature empowers brands to swiftly search and locate all social media content from the influencer through a robust search engine. By choosing criteria such as “Platform Type,” “Post Type (Image/Video),” and “Time Range,” and inputting relevant “Keywords,” brands can find relevant influencer-generated content. The search results can be sorted using parameters such as “Publication Date,” “Interactions,” “Views,” “Likes,” and “Comments,”.
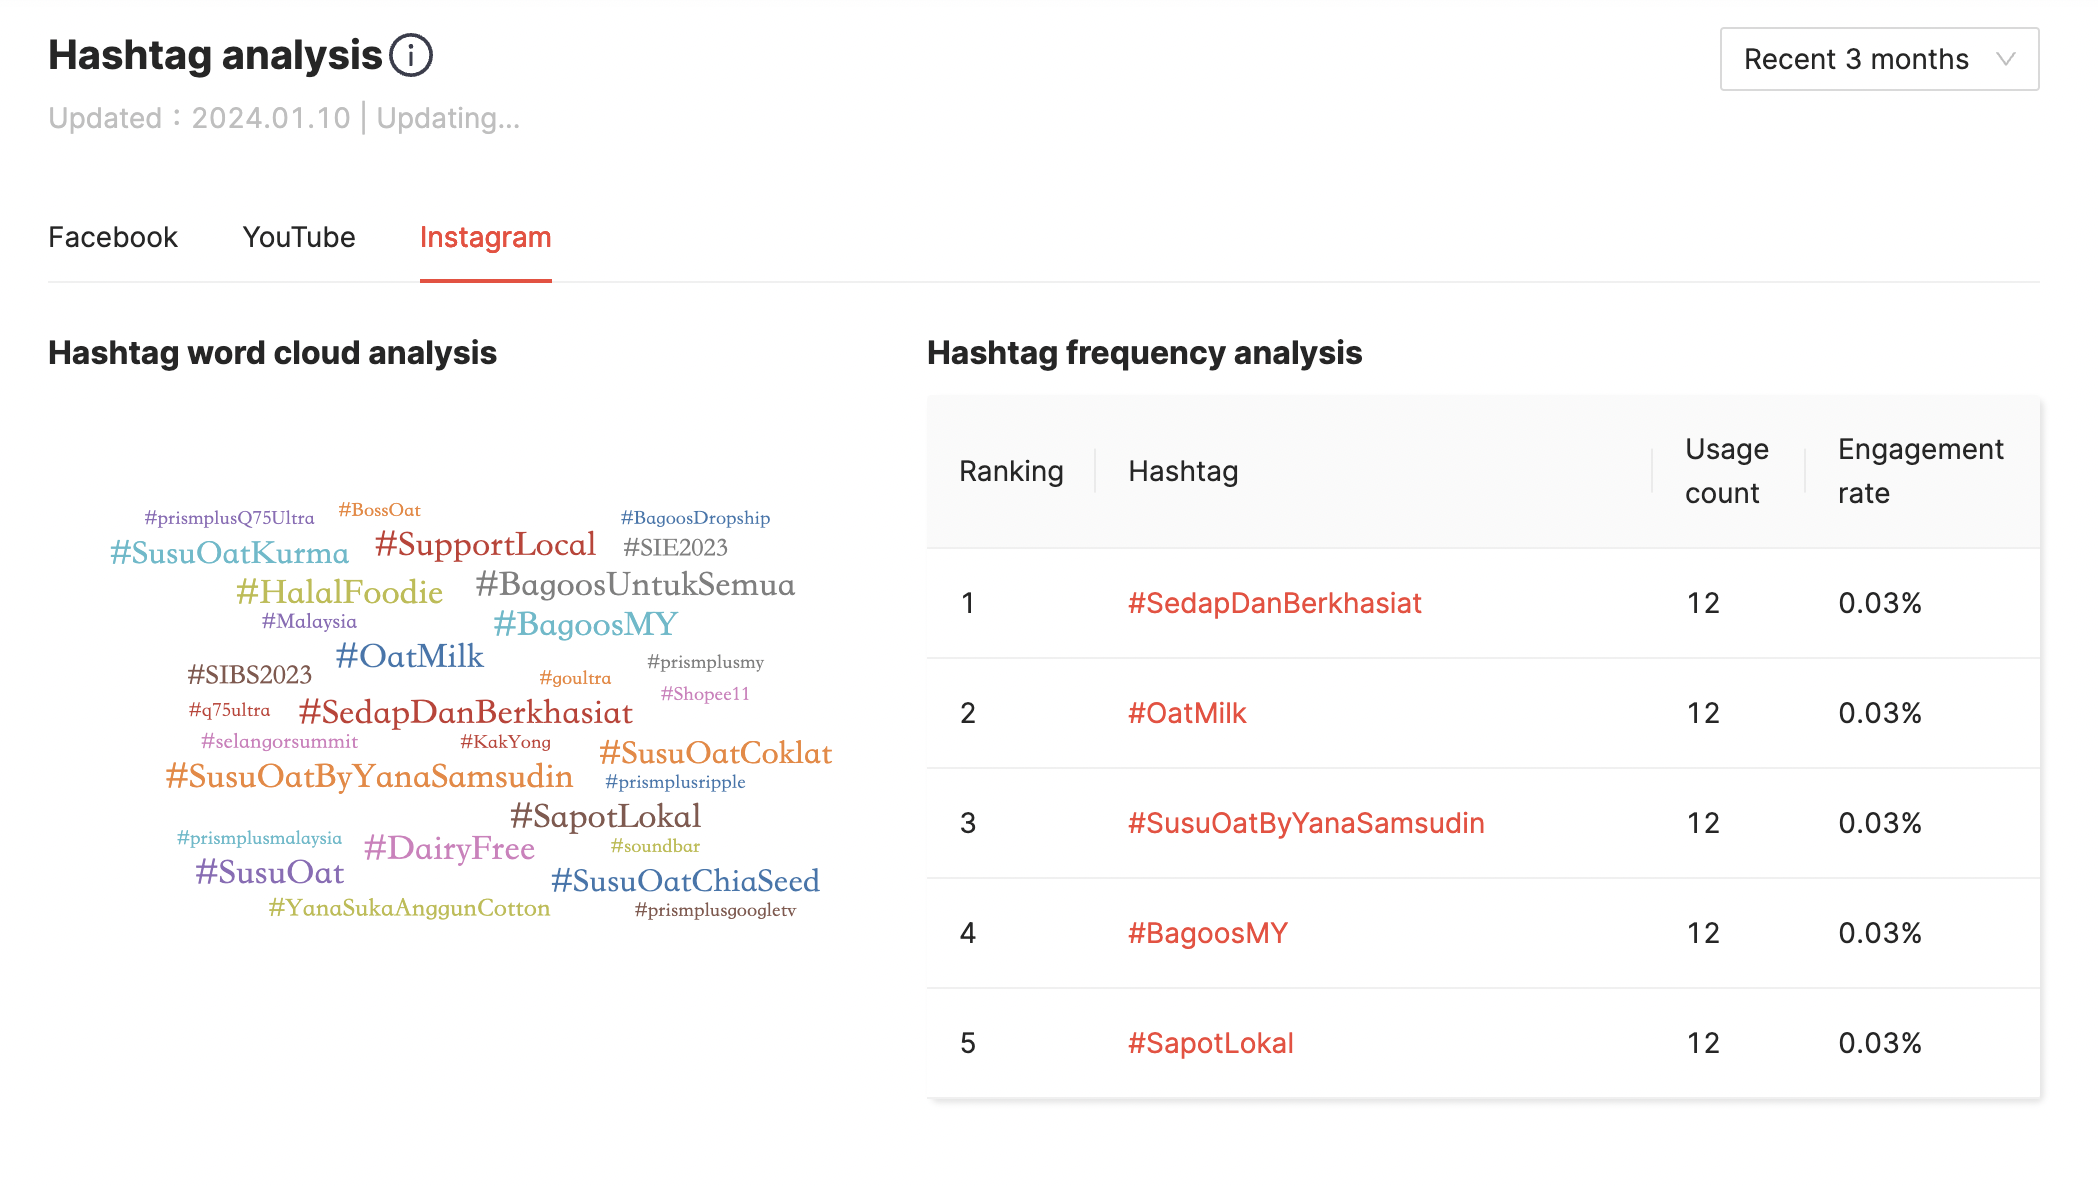
10. Creative Content Hashtag Analysis: Discover Influencer Community Trends
Hashtags have always been an indicator to grasp community trends gaining insights on the thematic tags frequently utilised by potential influencers. This enables a deeper understanding of the influencer’s style and the impactful themes within their social media accounts. Brands can leverage KOL Radar’s newly introduced “Creative Content Hashtag Analysis” feature to explore the content across various social platforms for each influencer in the last six or three months.
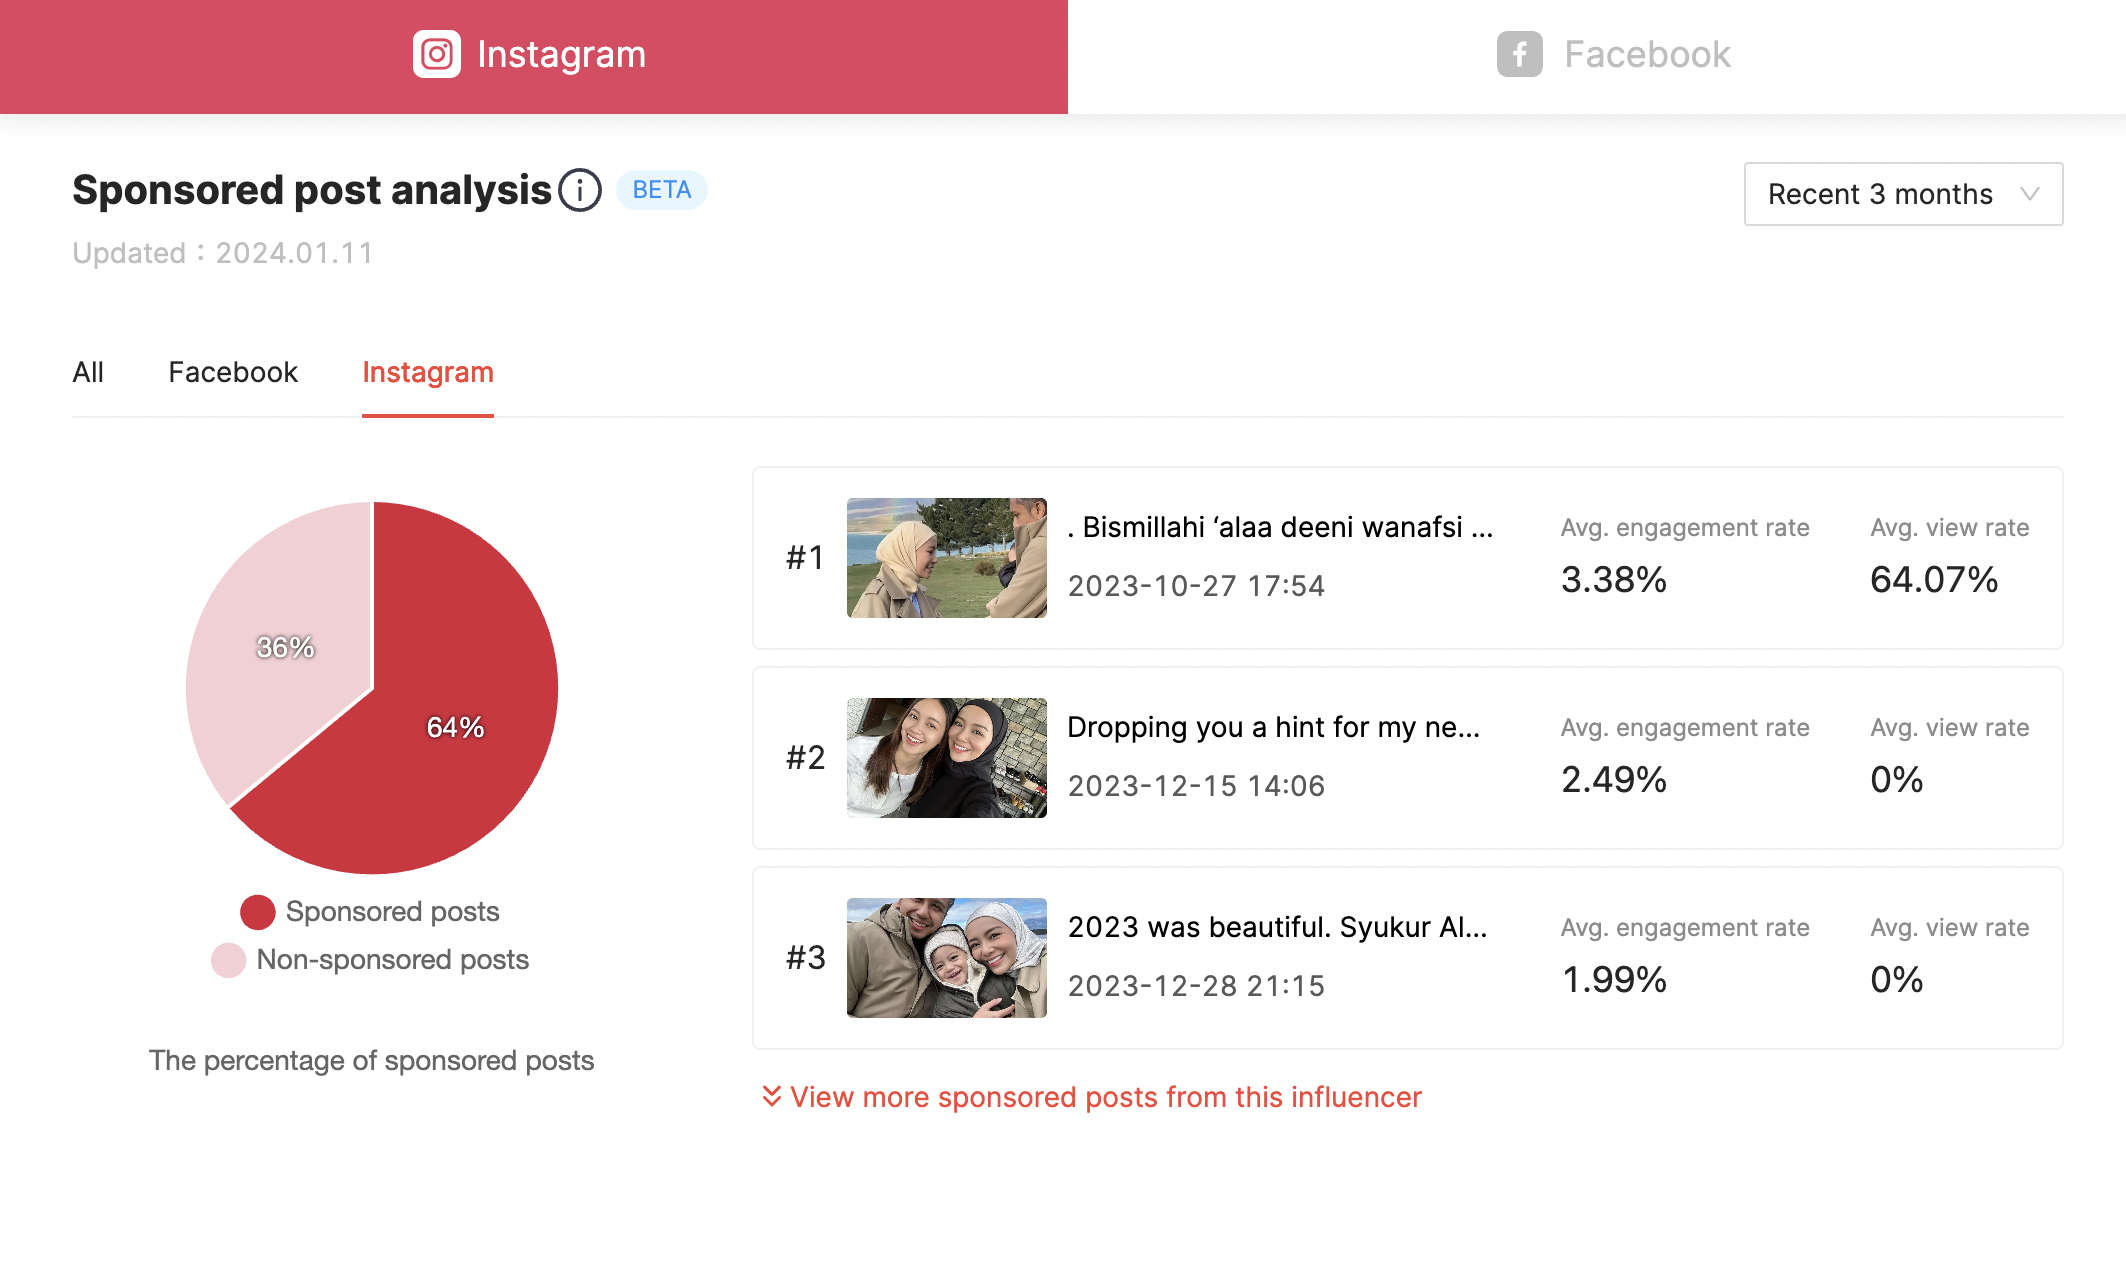
11. Business Collaboration Content Analysis: Assess Sponsored Content
Manually sorting through influencer-sponsored content to calculate its effectiveness is not only time-consuming but also prone to errors. KOL Radar utilises an exclusive AI business collaboration model to automatically determine whether an influencer’s content is sponsored collaboration. It calculates the coverage ratio of business collaboration content within the influencer’s social media posts in the last three or six months. Additionally, it aggregates popular and effective sponsored content of influencers for brands to reference. Through business collaboration content analysis, brands can efficiently review influencer’s sponsored content, and swiftly comprehend the effectiveness and style of their collaborations, serving as a crucial reference when selecting collaboration partners in the future!
Conclusion
The KOL Radar Premium package introduces a diverse range of data dashboards and advanced in-depth analytics, enabling brands to grasp the dynamics and effectiveness through influencer data. This empowers them to devise more precise AI-driven influencer marketing strategies, identify the most suitable collaboration partners, craft highly engaging content, and achieve effective marketing outcomes!

Interested in executing influencer marketing effortlessly using in-depth data? Learn more detailed information: https://www.kolradar.com/en/
▶︎ This article may not be reproduced, redistributed, publicly broadcasted, or publicly transmitted in any form. Copyrights and portrait rights of the images and data cited in this article remain with the original rights holders.


 Get your ultimate AI-powered marketing strategy backed with competitors analysis!